
Dynamics 365 Business Central Manufacturing: Analysing Routing
Evaluate your actual production times to your planned production times to improve costing, margins, and scheduling.
What Is Routing Analysis for Dynamics 365 Business Central Manufacturing?
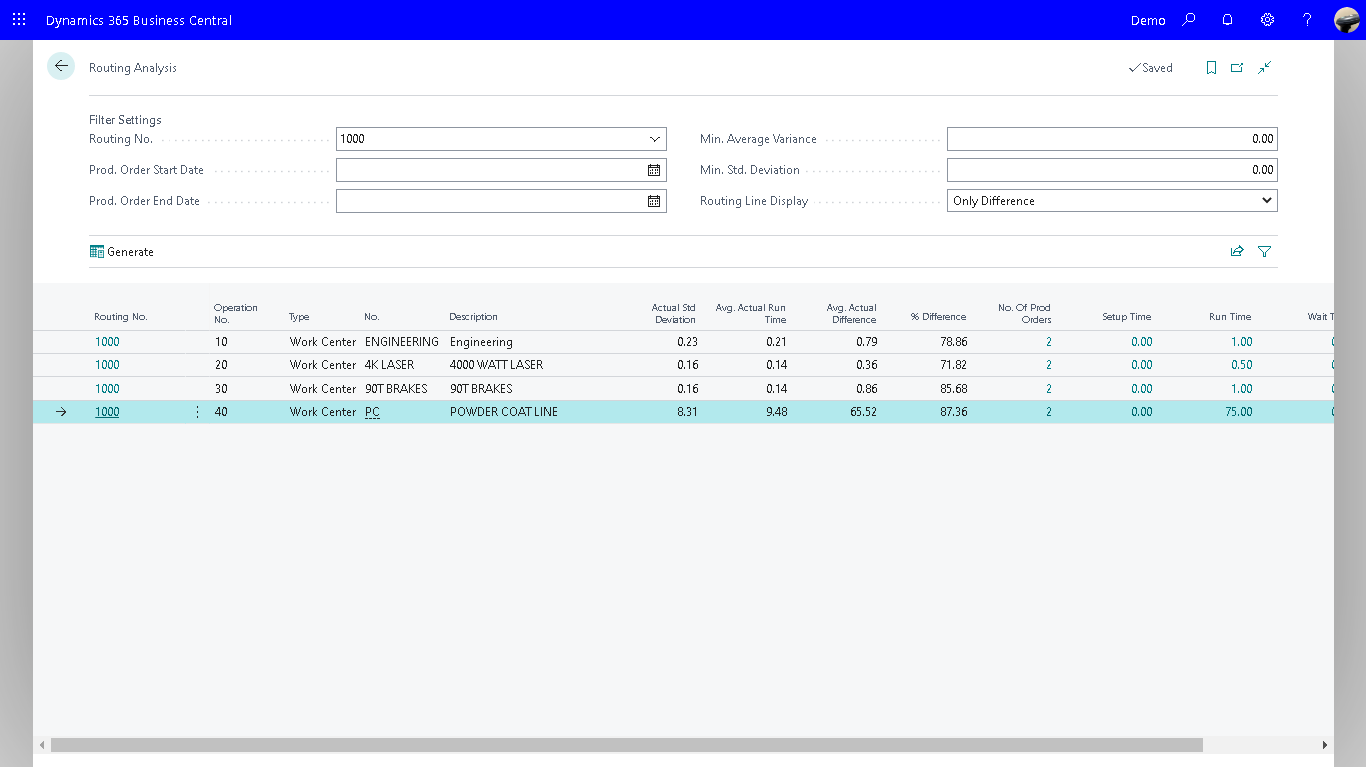
The Routing Analysis tool offers historical data on the run times for routing operations on completed production orders, facilitating the analysis of execution efficiency and variability. Furthermore, Routing Analysis enables the customization of routing operation times.
To do so one needs to consider:
- Routing No.
- Prod. Order Start Date
- Prod. Order End Date
- Min. Average Variance
- Min. Std. Deviation
- Routing Line Display
From this you would then view and edit the configured operation times:
- Setup Time
- Run Time
- Wait Time
- Move Time
How accurate are your scheduled production run times on your routes?
Manufacturers considering using Microsoft Dynamics 365 Business Central and looking to optimise the production process you will want to review how you might compare your real production durations to your scheduled production times in order to enhance cost management, sales margins, and scheduling accuracy
In summary: The Routing Analysis tool offers historical statistics on the duration of routing operations as they pertain to completed production orders. This enables an in-depth assessment of execution efficiency and variations. Additionally, Routing Analysis provides the capability to modify the operation times within the routing
If you wonder how accurate your scheduled production run time is on your routings then you will appreciate the capabilities of the routing analysis extension. With this enhanced capability you will easily compare average actual run time with scheduled runtime to help optimise the manufacturing process.
The routing analysis app generates reports based on:
-
Routing Number
-
Date
-
Minimum Average Variance
-
Other Variables
Optimise Manufacturing Processes
The Routing Analysis Extension for Dynamics 365 Business Central generates reports that can be sorted by routing number, date, minimum average variance, and other factors, enabling you to assess the average actual run time compared to the scheduled run time. This report is a valuable tool for optimising your manufacturing processes, pinpointing bottlenecks, and identifying opportunities to boost equipment utilization
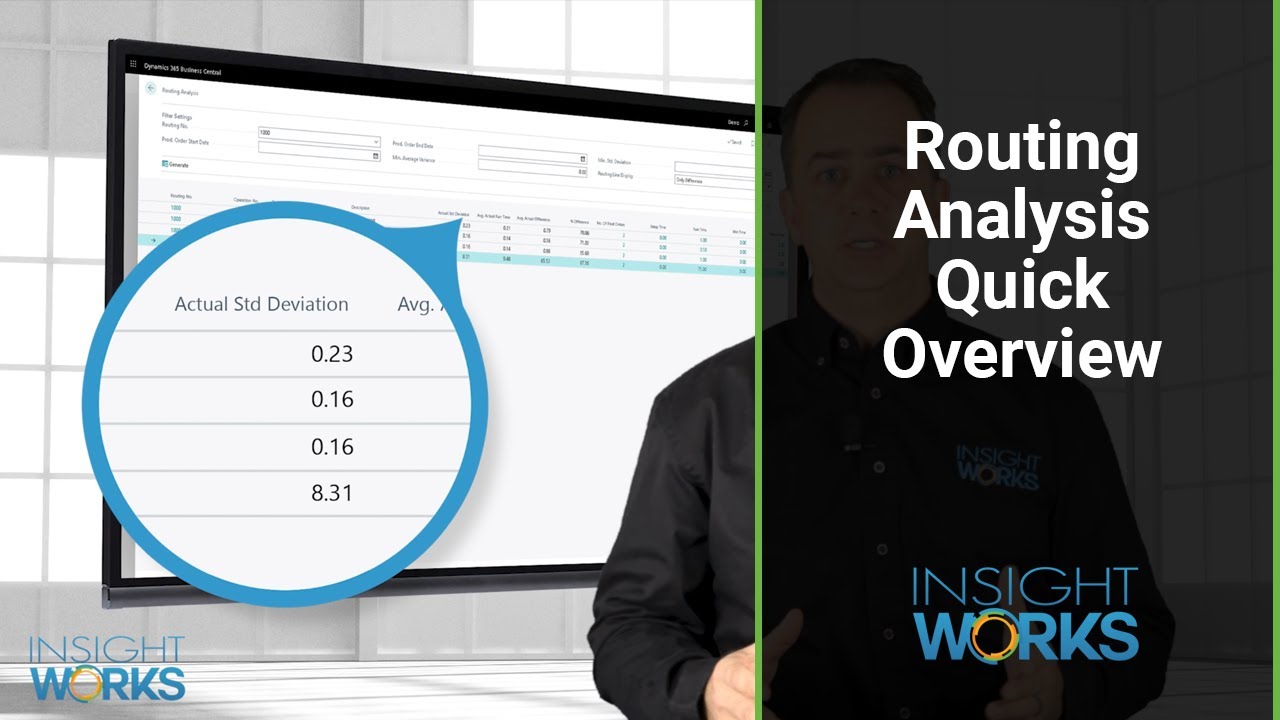
Measure variation
By executing Routing Analysis the system calculates the standard deviation to detect irregularities within the manufacturing process. A lower standard deviation indicates consistent, repetitive processes with consistent timings. Conversely, a high standard deviation suggests production variations in a specific routing, highlighting an opportunity for process optimisation
Book a Complimentary ERP Assessment
Book a complimentary ERP assessment with Cloud Factory to review your current systems, identify operational gaps and determine the right solution to support your business growth.